“By failing to prepare, you are preparing to fail.” – Benjamin Franklin
Mauna Loa has been in the news lately, as the volcano continues to awaken from its slumber. While an eruption of Mauna Loa is not imminent, now is the time to revisit personal eruption plans. Similar to preparing for hurricane season, having an eruption plan in advance helps during an emergency.
What can you do if you live on or near Mauna Loa? A few simple steps can help you prepare: First, learn about the volcanic hazards that could affect your community. Next, develop a plan with your ohana — what you will do during a natural hazards emergency. Finally, help your community prepare. A few minutes spent preparing now could keep you, your ohana, and your community safe.
How can you learn what to expect during a Mauna Loa eruption? The USGS Hawaiian Volcano Observatory website has information on lava flows and other volcanic hazards, including a fact sheet specifically about Mauna Loa hazards (https://pubs.usgs.gov/fs/2012/3104/fs2012-3104.pdf).
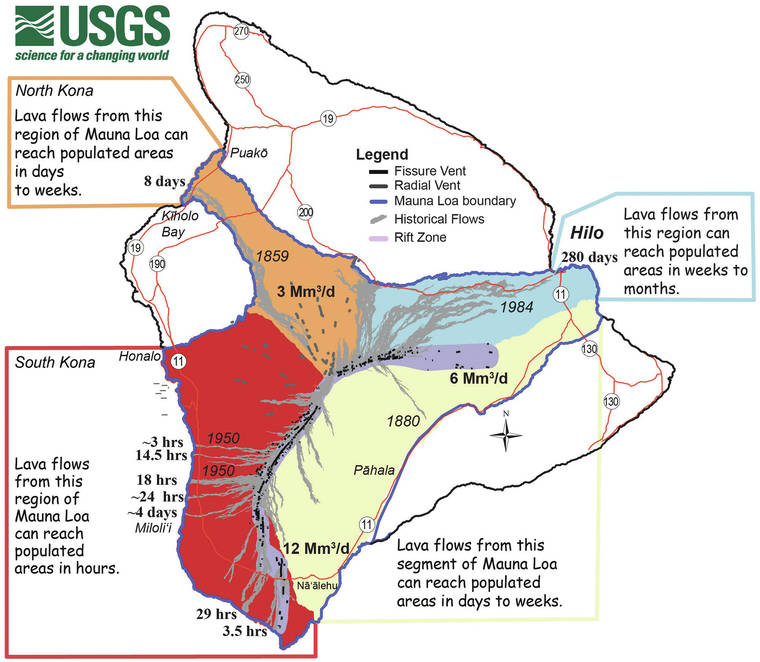
The map shown here — modified from the factsheet — indicates the response time people can expect based on the travel times of Mauna Loa eruptions over the past 200 years. Different sectors around Mauna Loa are colored according to how quickly lava flows can reach populated areas.
The Hilo area is in blue: lava traversing the northeast portion of the volcano travels at a modest clip. Mauna Loa flows in the past reached Hilo in weeks to months due to the greater distances to populated areas and gentle slopes in the uplands that slow down flow advance.
The southeast flank of the Mauna Loa is in yellow: flows travel at a moderate clip and can reach populated areas in days to weeks. This flank has steep to moderate slopes. In 1880, an ‘a‘a flow traversed 20 km (16 miles) in 7 days as it advanced toward Kilauea.
Mauna Loa’s northwest flank is in orange: flows can reach populated areas in days to weeks. This flank has moderate to steep slopes and flows travel at a moderate clip. Radial vents in this region in the past issued lava from below sea level to the summit of the volcano. This region is orange because if a radial vent eruption starts low on the flanks, precious little time may be available for response efforts.
The west side of Mauna Loa’s Southwest Rift Zone (SWRZ) is in red: flows can reach populated areas in hours because of the steep slopes and vigorous lava production. Many flows from the SWRZ have entered the ocean in less than a day (see map for travel times).
How can you prepare for a Mauna Loa eruption? The most important thing you can do is to have a personal response plan — especially if you live in or near the red zone. Nowadays, people pack “go” bags containing essential items in case you have to leave your house under an evacuation order. You may want to include important documents, like your birth certificate, deeds, legal papers, and medications. See an example “go” bag checklist here: https://dod.hawaii.gov/hiema/files/2016/03/GoBagFlyer.pdf.
Where will the ohana go when an eruption starts? Let’s say you live in South Kona. During the day, your tutu and pets stay home but you go to work in North Kona and the kids go to school in Naalehu. Imagine an eruption starts on Mauna Loa while you are at work. If your family prepares and implements an eruption plan, the details are taken care of and the ohana can meet in a predetermined place. It is useful to also have a communication plan, so you can be in touch with those you care about.
What other resources are available to help a community with eruption planning?
The Hawaii County Civil Defense website has a whole section devoted to preparedness: https://www.hawaiicounty.gov/departments/civil-defense/emergency-preparedness. Lava inundation zone maps for Mauna Loa are available online and at local libraries.
They illustrate what portion of the volcano can send flows in specific directions: https://pubs.er.usgs.gov/publication/sim3387.
As long as people continue to live on the flanks of Hawaii’s active volcanoes, the risks from lava flow hazards are real and potentially tragic. We all can do our part to reduce the impact to people and property through education, land-use planning, and response plans.
Volcano
activity updates
Kilauea Volcano is erupting. Its USGS Volcano Alert level is at WATCH. Kilauea updates are issued daily.
Lava activity is confined to Halema‘uma‘u with lava erupting from a vent on the northwest side of the crater. Laser rangefinder measurements this morning, March 11, indicate the lava in western (active) portion of the lake is 221 m (725 ft) deep, with the eastern portion of the lava lake solidified at the surface. The summit tiltmeters show deflationary tilt since late yesterday evening. Sulfur dioxide emission rates measured on March 7 were 800 t/d. Seismicity remains stable, with elevated tremor. For the most current information on the eruption, see https://www.usgs.gov/volcanoes/Kilauea/current-eruption.
Mauna Loa is not erupting and remains at Volcano Alert Level ADVISORY. This alert level does not mean that an eruption is imminent or that progression to an eruption from the current level of unrest is certain. Mauna Loa updates are issued weekly.
This past week, about 183 small-magnitude earthquakes were recorded beneath the upper-elevations of Mauna Loa; most of these occurred at depths of less than 6 kilometers (about 4 miles). Global Positioning System measurements show continued slow summit inflation, consistent with magma supply to the volcano’s shallow storage system. A slight increase in the rate of inflation at the summit, that began in January, is continuing. Gas concentrations and fumarole temperatures at both the summit and at Sulphur Cone on the Southwest Rift Zone remain stable. Webcams show no changes to the landscape. For more information on current monitoring of Mauna Loa Volcano, see: https://www.usgs.gov/volcanoes/mauna-loa/monitoring.
There were 2 events with 3 or more felt reports in the Hawaiian Islands during the past week: a M2.7 earthquake 2 km (1 mi) SSE of Pepeekeo at 45 km (28 mi) depth on March 10 at 7:18 p.m. HST and a M4.2 earthquake 17 km (10 mi) NNE of Pahala at 26 km (16 mi) depth on March 10 at 2:21 p.m. HST.