When lava flows break out on the flanks of Kilauea or Mauna Loa, Hawaii residents and emergency management agencies want to know what to expect.
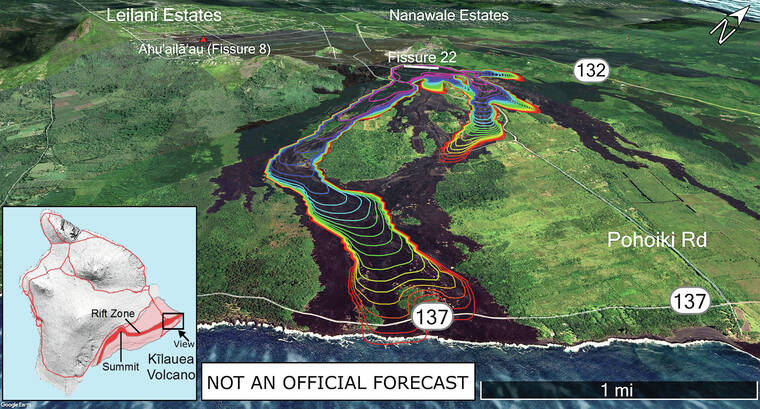
During the 2018 Kilauea Lower East Rift Zone eruption, lava from 24 fissures inundated more than 8,000 acres (3,200 hectares) of land in the Puna District and more than 700 structures were destroyed. Sobering figures like these highlight the need for forecasting the advance of lava flows to help emergency managers, residents, and USGS Hawaiian Volcano Observatory staff. Highly accurate forecasts for other natural hazards such as hurricanes, flooding, drought, and even the spread of vog from Kilauea are now commonplace. Can we do the same for lava flows?
The most successful forecasting efforts for other natural hazards rely on the ability to simulate flows of water or air. Even though the motion of these fluids is typically much more complex than that of lava, we know a great deal more about water and air than lava as a material. After all, we can’t see inside a lava flow to observe what is happening below the surface the way we can for water and air.
At the heart of hazard forecasts are computer algorithms crunching the numbers as fast as possible to make a relevant forecast. After all, a prediction of severe flooding in 24 hours is not very useful if it takes 23 hours to make that forecast.
Although researchers have been applying the principles of fluid dynamics to lava flows for more than 40 years, most simulations are too slow to use during a crisis when we really want to know the answer to the questions: Where’s that lava headed and when will it get there?
To help answer that question, HVO scientists have for many years forecasted the general path of lava flows using the principle of steepest descent — that lava flows downhill. In many cases, these forecasts have worked really well; however, this method can’t by itself answer the second part: “… and when will it get there?” because it predicts only the route, not the speed or the flow’s final length.
To help answer these questions, USGS scientists are developing a new lava flow forecasting model based around the physics-based simulation of lava as it flows across real topography while cooling and solidifying. This model is designed with simplified, but realistic physics, enabling the simulation of 24 hours of lava advance in as little as a couple of minutes on an ordinary laptop.
This research is supported by the Additional Supplemental Disaster Relief Act of 2019 (H.R. 2157), which has also funded the work of many HVO projects that have been the subjects of recent “Volcano Watch” articles.
Of course, we don’t have perfect knowledge or measurements of our model inputs, so a single simulation doesn’t provide much information about our confidence in a forecast. By running the code many times with a range of inputs, the collection — or ensemble — of all these models can give us a much better idea of the range of possible outcomes. This has been a common practice in forecasting hazardous weather such as hurricanes for many years and is now the cutting edge in volcanic hazards research. HVO scientists are investigating how to produce ensembles using this new model, with the goal of successfully forecasting lava inundation during future eruptions.
Although there is a great deal we do not know about what a volcano is about to do, we can make some short-term forecasts based on what is currently happening. These forecasts, even over short periods of time, give people in the path of lava flows the ability to plan, providing critical answers to the questions: “Where’s that lava headed and when will it get there?”
Join us this week for two programs about the one-year anniversary of Kilauea volcano’s summit eruption in Hawaii Volcanoes National Park. On Tuesday at 7 p.m., an After Dark in the Park presentation by HVO Deputy Scientist-in-Charge David Phillips; and on Thursday at 3 p.m., a “Year on the Edge” talk by a Hawaii Volcanoes National Park ranger and HVO scientist. Details about these talks are at https://www.nps.gov/havo/learn/news/september-2022-events.htm. Email askHVO@usgs.gov for more info.
Volcano
activity updates
Kilauea volcano is erupting. Its USGS Volcano Alert level is at WATCH (https://www.usgs.gov/natural-hazards/volcano-hazards/about-alert-levels). Kilauea updates are issued daily.
Over the past week, lava has continued to erupt from the western vent within Halema‘uma‘u crater in Hawai‘i Volcanoes National Park. Sulfur dioxide emission rates remain elevated and were last measured at approximately 930 tonnes per day (t/d) on September 21. Seismicity is elevated but stable. At the summit, a brief earthquake swarm and elevated rates of ground deformation occurred on September 20. No unusual activity has been noted along the East Rift Zone or Southwest Rift Zone. For more information on the current eruption of Kilauea, see https://www.usgs.gov/volcanoes/Kilauea/recent-eruption.
Mauna Loa is not erupting and remains at Volcano Alert Level ADVISORY. This alert level does not mean that an eruption is imminent or that progression to an eruption from the current level of unrest is certain. Mauna Loa updates are issued weekly.
This past week, about 190 small-magnitude earthquakes were recorded below the summit and upper elevation flanks of Mauna Loa — the majority of these occurred at shallow depths less than 15 kilometers (9 miles) below sea level. Global Positioning System measurements show low rates of ground deformation over the past week. Gas concentrations and fumarole temperatures at both the summit and at Sulphur Cone on the Southwest Rift Zone have remained stable over the past week. Webcams show no changes to the landscape. For more information on current monitoring of Mauna Loa, see: https://www.usgs.gov/volcanoes/mauna-loa/monitoring.
Six earthquakes were reported felt in the Hawaiian Islands during the past week: a M3.4 earthquake 10 km (6 mi) NE of Pahala at 31 km (19 mi) depth occurred on Sept. 20 at 6:02 p.m. HST, a M2.3 earthquake 5 km (3 mi) E of Pahala at 33 km (20 mi) depth on Sept. 20 at 5:41 a.m. HST, a M3.4 earthquake 11 km (6 mi) NW of Kalaoa at 43 km (26 mi) depth on Sept. 20 at 5:20 a.m. HST, a M3.2 earthquake 14.1 km (8.8 mi) S of Volcano at 5 km (3 mi) depth on Sept. 17 at 5:19 a.m. HST, a M3.2 earthquake 16 km (9 mi) S of Volcano at 7 km (4 mi) depth on Sept. 17 at 1:39 a.m. HST, and a M3.8 earthquake 46 km (28 mi) S of Lanai City at 14 km (8 mi) depth on Sept. 16 at 6:19 a.m. HST.
Please visit HVO’s website for past Volcano Watch articles, Kilauea and Mauna Loa updates, volcano photos, maps, recent earthquake info, and more. Email questions to askHVO@usgs.gov.