Volcano Watch: Reading the rainbow; How to interpret an interferogram
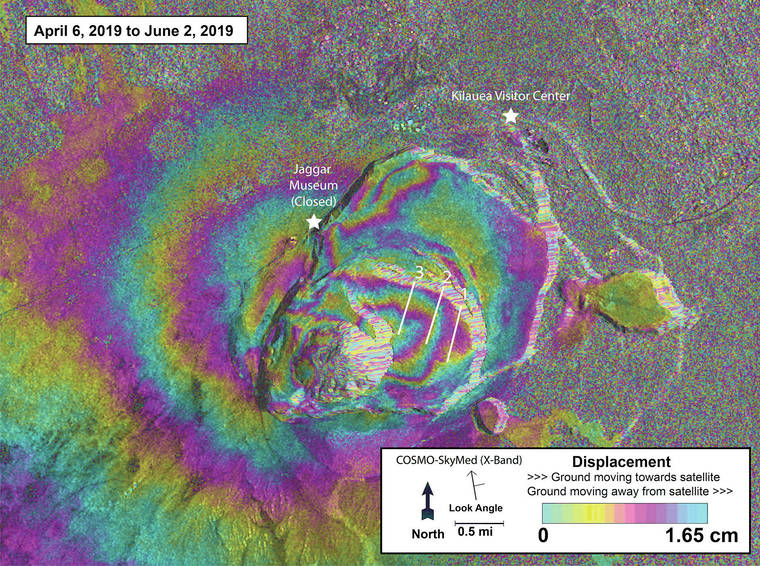
USGS graphic COSMO-SkyMed (CSK) Interferogram for the period from April 6-June 2, covering Kilauea Volcano’s summit region. Each color fringe represents 1.65 centimeters (0.65 inches) of ground displacement. The closely spaced color bands, or fringes, within the caldera indicate localized inflation, while the broader fringes on the northwest side of the caldera indicate a small amount of inflation centered near the Jaggar Museum. Each color cycle or fringe within the caldera is marked by white numbers on the interferogram for a grand total of 3 fringes or total displacement of 4.95 cm (1.95 inches). CSK data are provided to the USGS Hawaiian Volcano Observatory by the Italian Space Agency for use in monitoring and research.
Since the early 1990s, scientists have used radar satellites to map movement, or deformation, of Earths surface.
Since the early 1990s, scientists have used radar satellites to map movement, or deformation, of Earth’s surface.
Interferometric Synthetic Aperture Radar (InSAR) calculates the difference between two radar images acquired by an orbiting satellite taken at different times but looking at the same place on Earth. This difference is called an interferogram, and is essentially a map of surface deformation.
ADVERTISING
Deformation is one of the main ways the Hawaiian Volcano Observatory monitors activity of Hawaii’s volcanoes. Volcanoes can change their shape as magma moves in and out of their plumbing systems, as their slopes shift on faults or because of gravity, and when they have internal changes in pressure.
Interferograms, together with GPS and tilt, help HVO scientists keep many eyes on a volcano when it’s getting bent out of shape.
Interferograms cover large areas of land — the entire Island of Hawaii can fit into a single radar scene — and provide centimeter-scale accuracy of ground motion. This means seeing changes of less than half an inch from space!
However, interferograms can be tricky to read. This Volcano Watch will guide you through interpreting an interferogram, as well as explain how they are produced.
The difference in the distance to the ground between two satellite passes, known as the interferometric phase, is shown as fringes, or bands, of color in an interferogram. This difference includes deformation of the surface that occurred between passes, but it also is influenced by uncertainty in satellite orbits, topographic ambiguities, atmospheric conditions and other sources of error. These all contribute to the interferometric phase. To get at the true movement of the ground, you have to compensate for these sources of error.
The first step in reading an interferogram is to determine “when” and “what.” The dates of each image answer the question of “when” the deformation occurred. Different satellites use different wavelengths, and that controls the amount of ground deformation represented per colored fringe — the “what.”
In the interferogram accompanying this Volcano Watch, the satellite used is the Italian Space Agency’s COSMO-SkyMed (CSK) system. The radar wavelength for CSK is X-band (approximately 3.3 centimeters in total length). Because an interferogram is made using radar waves that travel to Earth from the satellite and back, the deformation is calculated in terms of half the wavelength. This means that when reading a CSK interferogram, one fringe is equal to 1.65 centimeters (or 0.65 inches) of change between the two dates.
Step two is to count the colored fringes to determine the amount of deformation shown in an interferogram.
Volcanic deformation is often concentric in shape, so start on the outside of the fringe pattern and count the number of color cycles from the edge of the deformed area to the center. Multiply the number of colored fringes by the half wavelength to determine the magnitude of the deformation.
Step three is to determine if the surface moved up or down.
To do this, as you count fringes from the outside to the inside of a concentric pattern, note the sense of color changes. Does the pattern go blue-purple-yellow in toward the center or blue-yellow-purple? The color scale at the bottom of the image reveals that blue-yellow-purple is an increasing trend, which in the accompanying interferogram, means the ground is moving toward the satellite — it is inflating! The color sequence should always be defined on a scale bar in the interferogram, along with the half wavelength, because not all interferograms use the same color sequence, and not all radar satellites have the same wavelength.
The last step is to interpret the information you collected.
On the accompanying CSK interferogram, there are three colored fringes inside Kilauea Caldera, which means the surface within this region moved toward the satellite, or inflated, by about 4.95 centimeters (1.95 inches) between April 6 and June 2. But remember, the colored fringes include not just displacement but also other influences, such as orbital errors and atmospheric anomalies. These sorts of anomalies are especially prevalent around tall mountains, such as Mauna Loa and Maunakea, and areas of very steep topography, such as the south flank of Kilauea.
In this case, atmospheric anomalies are probably not an issue since the area of deformation is smaller than most weather patterns. We also compensate for orbital errors since we know the satellite orbits very precisely. But topographic errors due to the massive changes that took place at the summit in 2018 might introduce a small amount of error to the measurement. Also, because radar satellites don’t look directly down on Earth, the deformation in interferograms is a combination of vertical and horizontal displacements, although vertical changes usually dominate.
And that’s how you read an interferometric rainbow!
For more information about how to read an interferogram, including a step-by-step infographic, check out UNAVCO’s outreach products at https://www.unavco.org/education/outreach/infographics/infographics.html.
Volcano activity updates
Kilauea Volcano is not erupting and its USGS Volcano Alert level remains at Normal. For definitions of USGS Volcano Alert Levels, see https://volcanoes.usgs.gov/vhp/about_alerts.html.
Rates of deformation, gas release and seismicity on Kilauea have not changed significantly during the past week.
Monitoring data have shown no significant changes in volcanic activity during the past week. Rates of seismicity across the volcano remain low. The two largest recorded earthquakes were a magnitude-2.4 on June 15 at the summit at a depth of 2 km (1.2 miles) and a magnitude-3.4 on June 13 in the upper East Rift Zone at a depth of 6 km (3.7 miles). One felt report was submitted for the magnitude-3.4 earthquake.
Real-time sulfur dioxide emission rates from the summit remain low. Sulfur dioxide emission rates at Pu‘u ‘O‘o remain below detection limits, with it last measured May 23.
Since early March, GPS stations and tiltmeters at the Kilauea summit have recorded deformation consistent with slow magma accumulation within the shallow portion of the Kilauea summit magma system (1-2 km or approximately 1 mile below ground level). However, gas measurements have yet to indicate significant shallowing of large volumes of melt. HVO continues to carefully monitor gas output at the Kilauea summit and East Rift Zone for important changes.
Further east, GPS stations and tiltmeters continue to show motions consistent with refilling of the deep East Rift Zone magmatic reservoir in the broad region between Pu‘u ‘O‘o and Highway 130. This trend has been observed since the end of the 2018 eruption; however, there is an indication on tiltmeters that this motion has been slowing down during recent weeks. While the significance of this pattern is unclear, monitoring data do not suggest any imminent change in volcanic hazard for this area.
Two earthquakes with three or more felt reports occurred in Hawaii this past week: a magnitude-3.4 quake 13 km (mi) southeast of Volcano at 6 km (mi) depth at 12:54 p.m. June 16 and a magnitude-2.8 quake 14 km southeast of Volcano at 6.8 km depth at 1:19 p.m. June 13.
Hazards remain at the lower ERZ and summit of Kilauea. Residents and visitors near the 2018 fissures, lava flows and summit collapse area should heed Hawaii County Civil Defense and Hawaii Volcanoes National Park closures and warnings. Civil Defense advises that lava flows from the 2018 eruption are primarily on private property; people are asked to be respectful and not enter or park on private property.
The USGS Volcano Alert level for Mauna Loa remains at Normal. A slight increase in detected earthquakes was noted during the past month. GPS instruments show slow inflation of the summit magma reservoir. Gas and temperature data showed no significant changes the past month.
HVO continues to closely monitor Kilauea and Mauna Loa for any signs of increased activity.
Visit HVO’s website (https://volcanoes.usgs.gov/hvo) for past Volcano Watch articles, Kilauea and Mauna Loa updates, volcano photos, maps, recent earthquake info and more. Call 808-967-8862 for weekly Kilauea updates. Email questions to askHVO@usgs.gov.
Volcano Watch (https://volcanoes.usgs.gov/hvo/hvo_volcanoo_watch.html) is a weekly article and activity update written by the U.S. Geological Survey Hawaiian Volcano Observatory scientists and affiliates.